fenced bar charts
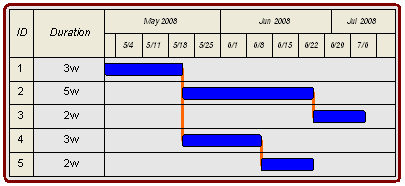
Since the Gantt or Bar Chart does not show sequence, a new type of Bar Chart was been created that makes the sequence between activities explicit. This type of Bar Chart is called the Fenced Bar Chart. Vertical lines, or "fences" are used to show the sequence.
The small schedule example used on the bar chart example is shown below and will be used to create the Fenced Bar Chart.
| Activity | Duration (work-weeks) |
Prior Activity |
|---|---|---|
| 1 | 3 | None |
| 2 | 5 | 1 |
| 3 | 2 | 2 |
| 4 | 3 | 1 |
| 5 | 2 | 4 |
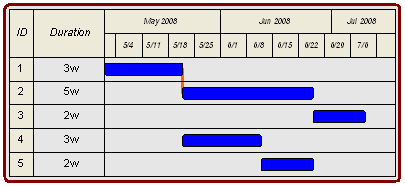
To create the Fenced Bar Chart, draw a vertical line between the activities to show the sequence. In the chart below, the line from the end of Activity 1 to the start of Activity 2 illustrates the sequence constraint that Activity 1 must be completed before Activity 2 can start.
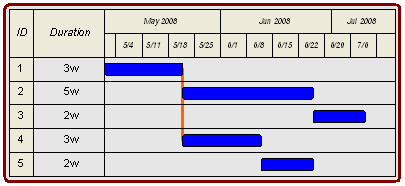
In the table above you can see also that Activity 1 also precedes Activity 4. To show this, extend the line connecting Activity 1 and Activity 2 down to the start of Activity 4. The resulting Fence shows that Activity 1 precedes both Activity 2 and Activity 4.
The final two sequences in our example projects are between Activity 2 and Activity 3 and Activity 4 and Activity 5. The figure below shows the fences that show the relationships between these Activities.
Fenced Bar Charts are extremely powerful and effective. Even projects with complex sequences can be shown using fenced bar charts. In the example below several activities share multiple prior activities.
| Activity | Duration (work-weeks) |
Prior Activity |
|---|---|---|
| 1 | 3 | None |
| 2 | 5 | None |
| 3 | 2 | 1,2 |
| 4 | 3 | 1,2 |
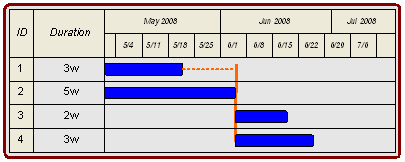
Here is an even more complex type of project plan that can be simply and clearly communicated with a fenced bar chart.
| Activity | Duration (work-weeks) |
Prior Activity |
|---|---|---|
| 1 | 3 | None |
| 2 | 5 | None |
| 3 | 2 | 1 |
| 4 | 3 | 1,2 |
| 5 | 1 | 2 |
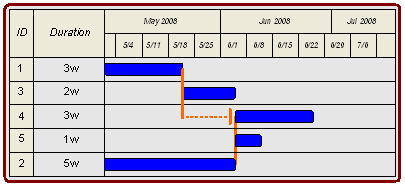
In the fenced bar chart shown above the activities are listed so that the fences do not cross activities. Activity 1 is at the top of the Chart and Activity 2 is at the bottom of the chart. Activity 3 and Activity 4 are shown to follow Activity 1. Activity 4 and Activity 5 are shown to follow Activity 2.
As work begins and the Fenced Bar Chart is updated, you can immediately see the impact of the job status on the project, and see how that impacts other activities in on the Fenced Bar Chart. See if you can answer the following questions using the Fenced Bar Chart above:
- What if Activity 1 takes an additional week to complete?
- What if Activity 3 took an additional 2 weeks to finish?
- What if Activity 2 took one week less to complete?
Given the very high visual impact of Fenced Bar Charts, it is surprising to me that these charts are not used more often.