arrow diagramming
Arrow Diagramming, also called the Arrow Diagram Method is one of the two versions of the Critical Path Method. Arrow Diagramming was originally called “activity on the arrow.” Arrow Diagramming provides model of project that combines the representation of sequence and duration. The Arrow Diagramming is useful because there is a clear link between the work to be accomplished and the diagram that represents that work. In addition, arrows are a common metaphor for time lines. Thus, Arrow Diagramming is, initially, very intuitive.
The Arrow Diagram was the project planning method developed after the Bar Chart. Arrow Diagramming was first used in the 1950's on mainframe computing systems. One of the terms introduced as part of the Arrow Diagram was the term "activity."
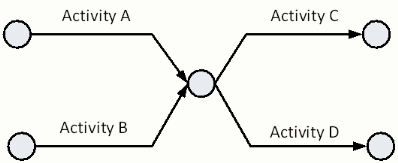
The two elements of Arrow Diagramming are arrows and nodes. One arrow is created for each activity to be accomplished. The tail of the arrow is the start of the activity. The head of the arrow is the end of the activity. While there is no requirement to do so, the length of the arrow is often scaled to be proportional to the duration of the activity.
At the tail, or start, and head, or end, of the activity arrows are nodes. Nodes are used to graphically show where activities end and begin in sequence. The starting node for a given activity is referred to as the activity’s “i-node.” The ending node for a given activity is called the activity’s “j-node.” This nomenclature was used since the mathematics behind the development of the Arrow Diagrams requires the use of the summation. Typically the terms of a summation include counting all the “I’s” and “j’s.”
Nodes are used to illustrate when activities precede or follow other activities. Nodes are placed at the start and end of each activity arrow. Since projects are defined by a specific start and end, there should be a single starting “i-node” and a single ending “j-node” for each project. The set of all activities, starting from the first activities’ i-node and ending with the last activities’ j-node is called a “network.” An Arrow Diagram for an entire project may also be called a Network Diagram. Despite advances in network theory and practice there are examples of large owners who continue to require “Network Analysis Systems” for their project schedules.
To illustrate how Arrow Diagrams are constructed, the diagram below provides several schedule fragments. First, the activities, durations, and sequence are listed. Next, the Arrow Diagram corresponding to that schedule fragment is displayed.
example one
| Activity | Prior Activity |
|---|---|
| A | None |
| B | A |

example two
| Activity | Prior Activity |
|---|---|
| A | None |
| B | A |
| C | A |

example three
| Activity | Prior Activity |
|---|---|
| A | None |
| B | None |
| C | A, B |
| D | A, B |

Arrow Diagramming is intuitive because arrows are a common metaphor for timelines. This combination of sequence and duration, however, causes unintended consequences for the scheduler. The reader should consider the following cases that are fully described later in the detailed description of the Arrow Diagramming Method.
examples for you to try
| Activity | Prior Activity |
|---|---|
| A | None |
| B | A |
| C | A |
| D | B, C |
| Activity | Prior Activity |
|---|---|
| A | None |
| B | None |
| C | A |
| D | A, B |